Attribution is the process of assigning credit to either one or multiple sources (aka touchpoints) a lead has with a brand over a period of time (known as the customer journey or conversion path) before they convert.
Attribution allows marketers to determine how the different channels impact the final conversion.
A conversion is any goal set up by a marketer: purchases a product, downloads a file (e.g. an ebook), or even fills in a contact form on a landing page.
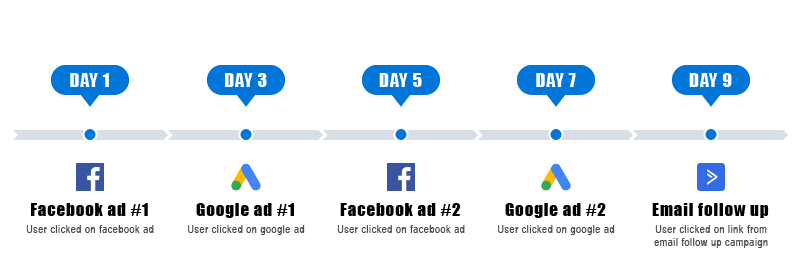
Let’s consider the example below and go through the attributions one by one. Let’s say a consumer first visited your website through a Facebook ad, then from an AdWords ad, then again from a different Facebook ad, then again from a different AdWords ad, then from an email follow-up and finally converted.
First touch attribution model
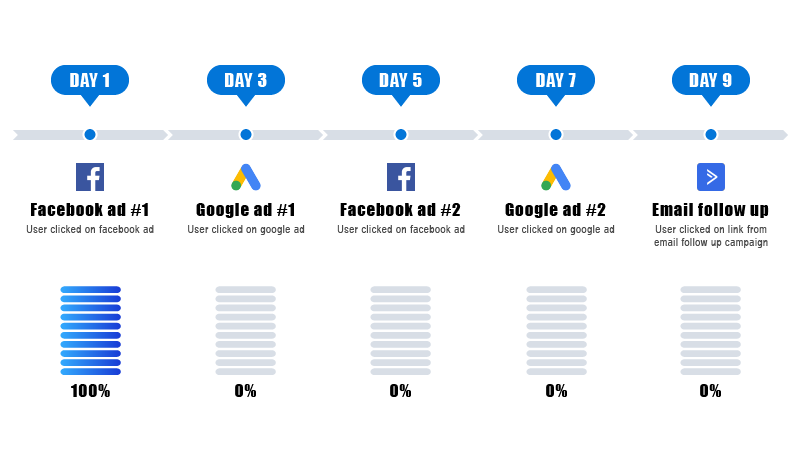
The first interaction (or first touch) attribution model is focused on the first known touchpoint in the customer journey.
With the first touch attribution model, 100% of the conversion is attributed to the first registered click.
So if we take the example above, then 100% of the conversion would be attributed to Facebook ad #1
Given that it ignores all other touchpoints, it should not be the only model being analyzed. However it is very useful for brand awareness campaigns or if you focus on channels your potential customers will interact with first.
Last touch attribution model
The last interaction (aka last touchpoint) or last click model is the oldest model out of them all and is used by default in many web analytics tools along with the last non-direct model.
With the last touch attribution model, 100% of the conversion is attributed to the last registered click. So if the last action before a conversion was a direct entry, then 100% of the conversion would be attributed to the direct entry.
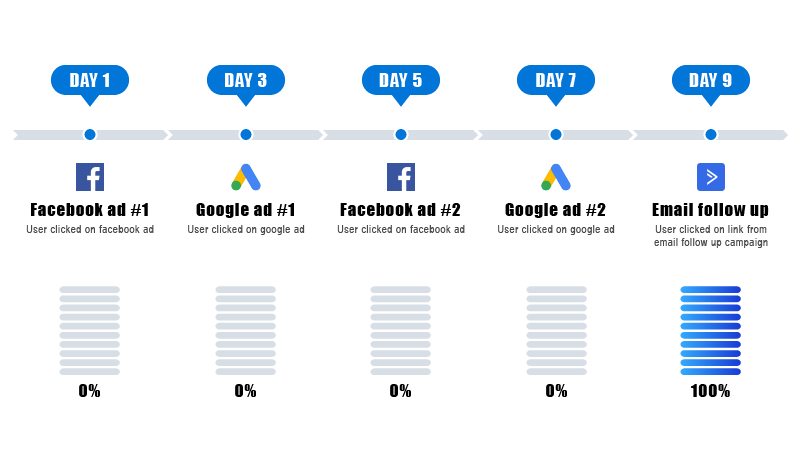
If we take the example above, then 100% of the conversion would be attributed to the Email follow up.
Just like the first touch attribution model, it totally ignores the other, in this case previous, touchpoints in the customer journey and can cause marketers to make very bad decisions.
Last non-direct attribution model
The last non-direct attribution model is very similar to the previous model but with one essential difference – it does not count direct visits from the equation. In this model, 100% of a conversion is attributed to the last known paid source.
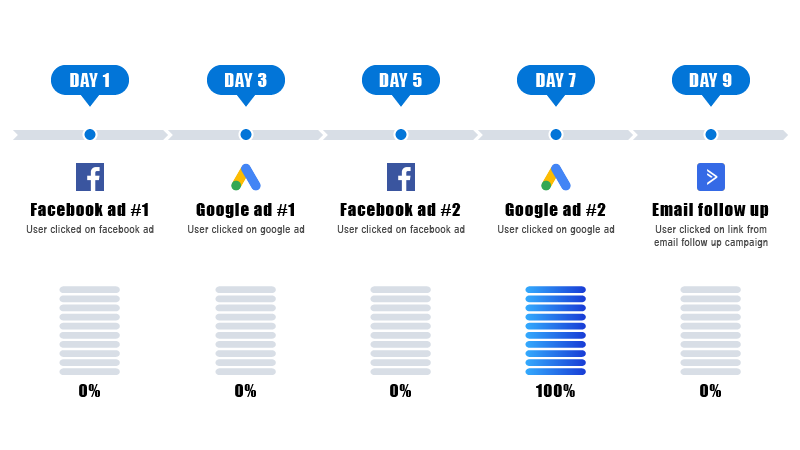
Taking the example above, with the last non-direct attribution model, 100% of the conversion is being attributed to the last paid source, AdWords ad #2.
This model is better than the last touch model, but still over-simplifies the multi-channel journey, not taking into account the rest of the touchpoints.
Linear attribution model
The linear attribution model is the first model that captures the true nature of channel overlap during the customer journey.
The linear model takes into account all touchpoints and clicks that can be attributed to a single conversion and aims to assign them equal credit.
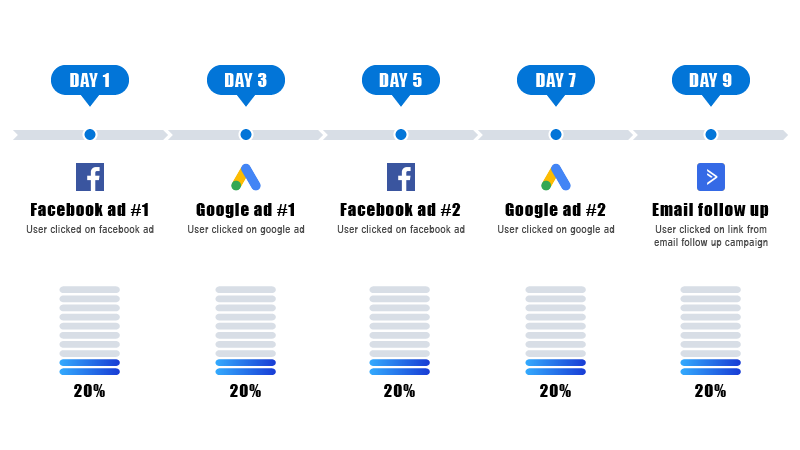
Taking the example above, all touchpoints are being attributed the same amount, 20% of the conversion value.
This model is quite useful if we want to get the full overview of the customer journey and if we know that each touchpoint can be valued equally (which rarely ever happens).
The disadvantage of this model is that it is unable to weigh up the importance of each individual touch point and click. In most cases, not every touchpoint or click will have the same impact on the final conversion – some touchpoints will influence a conversion more than others.
Time-decay attribution model
The time decay attribution model is a very interesting modification of the linear model.
This model not only takes into account all touch points in the customer journey, but it also uses an algorithm that weights in each click:the highest percentage of credit is awarded to the touchpoint that is closest in time to the conversion.
The remaining touchpoints and/or clicks would receive less credit as they are further away from the time of conversion. Also, the further away a touch point is from the conversion, the more its credit “decays”.
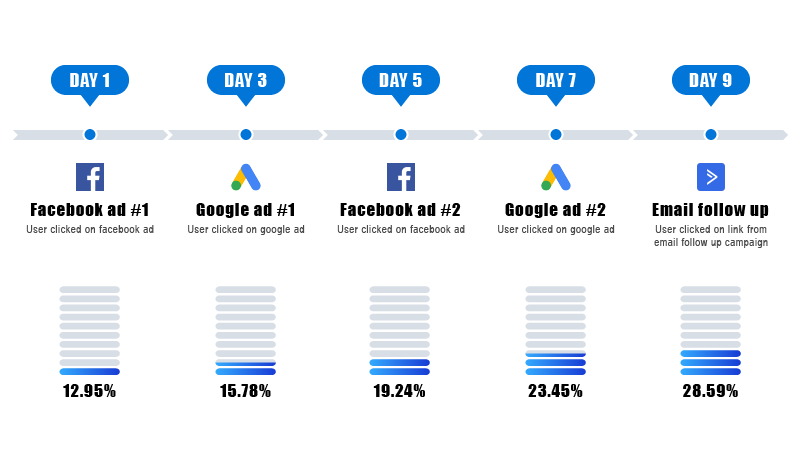
Let’s take the example above and run the algorithm. Using the time-decay model, the attribution value would look like this:
- 12.95% of the conversion is attributed to Facebook ad #1
- 15.78% of the conversion is attributed to Google AdWords ad #1
- 19.24% of the conversion is attributed to Facebook ad #2
- 23.45% of the conversion is attributed to Google AdWords ad #2
- 28.59% of the conversion is attributed to Email Follow up
The time-decay model is recommended for analyzing most marketing campaigns and funnels. It’s especially useful for businesses that want to decrease the length of their conversion journey – get visitors to convert sooner.
U-shaped attribution model
The U-shaped attribution model or position based attribution model will grab all the touch points and clicks in the customer journey and assign them credit based on their position in the conversion path.
This model assumes that the most important touch points are the very first touch point at the beginning of the customer journey and the one taking place directly before a conversion. All the touch points and clicks in between only play a supplemental role.
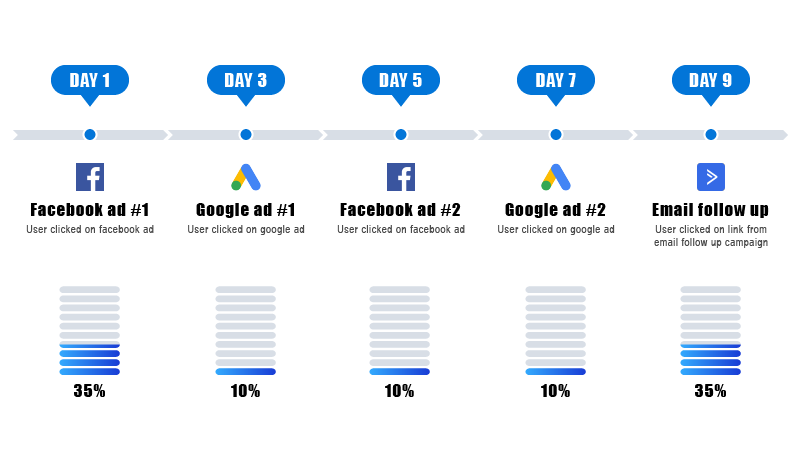
Taking the example above, we would attribute each touch point like this:
- 35% of the conversion is attributed to Facebook ad #1
- 10% of the conversion is attributed to Google AdWords ad #1
- 10% of the conversion is attributed to Facebook ad #2
- 10% of the conversion is attributed to Google AdWords ad #2
- 35% of the conversion is attributed to Email Follow up
This is a highly recommended model for marketers who want to get involved with attribution models but are not sure which model will be most suitable for them.
This mode is not a perfect attribution model because it doesn’t suit all business and funnels, but it’s a very good attribution model that allows you to make smarter marketing decisions.