In the analyze section, our algorithm will connect the data we gathered with the data from all the active integrations you set and provide a list with the best selling campaigns and most profitable ads.
You can select the timeframe of the report and filter the results by origin ( integrations ) and other tag ( for example, when analyzing a report for just one product )
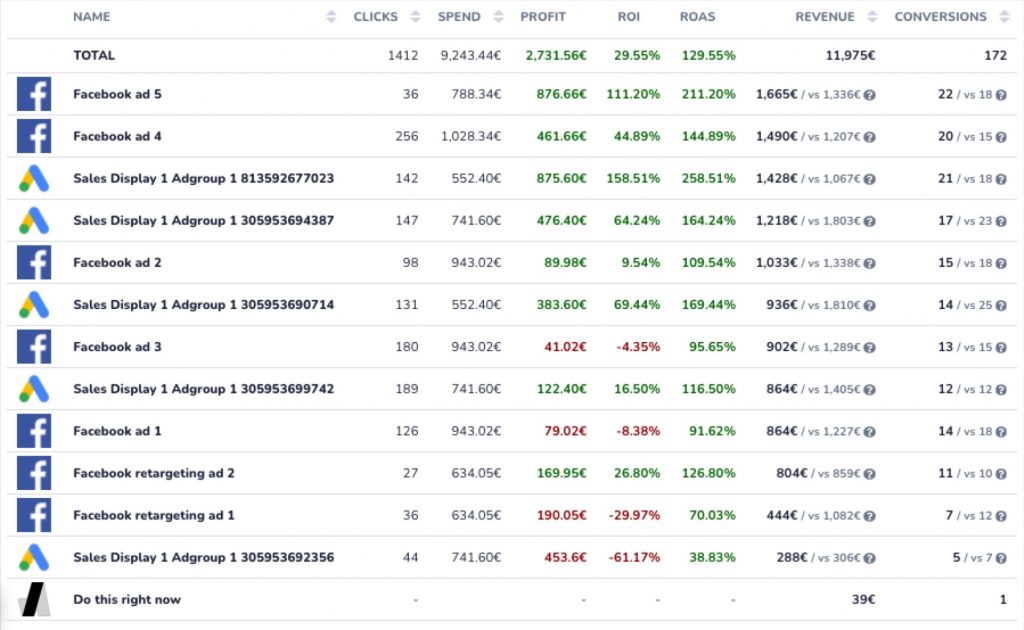
The results are displayed as the example below, allowing you to read the most profitable ads, how many sales they generated, how much money they made as well as how much they cost and how many interactions they had.
Also, you can compare the results from Atlass with the reported data from the 3rd party apps, data which is pulled directly from the ads manager:
- Revenue: tracked by Atlass / tracked by 3rd party ( Facebook, Google, etc )
- Conversions: tracked by Atlass / tracked by 3rd party ( Facebook, Google, etc )
To give a better understanding of the marketing campaign, the data can be analyzed using different attribution models.